Last week, we took a look at the city of Peoria, AZ and the Vistancia subdivision's 2013 to 2015 pertinent rental market figures.

This week, we will look at rental market statistics from 1st and 2nd Quarters 2013-2015 in the City of Buckeye, AZ. All figures are taken from closed rental data from the MLS.
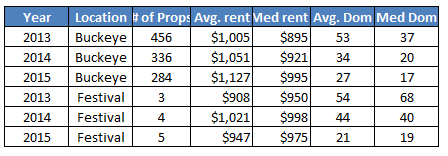
The break down will focus on the subdivision of Festival Foothills.
We will analyze the Buckeye rental market data from 1st quarter and 2nd Quarter of 2013 and 2014 and compare it with data from 1st Quarter and 2nd Quarter to date in 2015.
The rental market numbers for Buckeye in this study are consistent with what we have experienced with the overall 2015 Phoenix Area Rental Market. The Festival Foothills comparison screams small sample size but it is what has happened with MLS listings and we will summarize the data based on what we have,
Overall, average rental prices in Buckeye has increased during this 2013-2015 time period. The median rental price has increase from 2013 to 2015 in Buckeye by $122, but has only increased in Festival Foothills by $39. Rental property inventory has decreased significantly in Buckeye.
In Buckeye average rental property rent rates in the time frames analyzed have increased only about 12% (from $1005 to $1127). The median rental price has shown an 12% increase.
Festival Foothills average and median rental property rent rates have increased a bit in the time frame studied. What is interesting though is the Average Days on Market has decreased by over 50% and median days on market has been cut in third from 68 days to 19 days. Based on this number, a price increase would be realistic to expect moving forward.