Last week, we took a look at the city of Anthem, AZ and the Anthem Country Club's subdivision's 2013 to 2015 pertinent rental market figures.

This week, we will look at rental market statistics in the City of Peoria, AZ. All figures are taken from closed rental data from the MLS.
The break down will focus on the subdivision of Vistancia.
We will analyze the Peoria rental market data from 1st quarter and 2nd Quarter of 2013 and 2014 and compare it with data from 1st Quarter and 2nd Quarter to date in 2015.
Let's take a look at the Peoria and Vistancia rental market data.
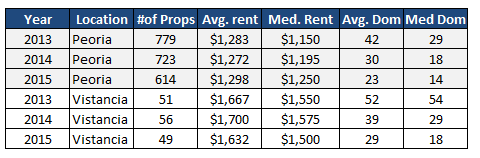
In Peoria average rental property rent rates in the time frames analyzed have increased only about 1% (from $1283 to $1298). The median rental price has shown an 8% increase.
Vistancia average and median rental prices have decreased in the time frame studied. What is interesting though is the Average Days on Market has decreased by almost 50% and median days on market has been cut in third from 54 days to 18 days. Based on this number, a price increase would be realistic to expect moving forward.
This week, we will look at rental market statistics in the City of Peoria, AZ. All figures are taken from closed rental data from the MLS.
The break down will focus on the subdivision of Vistancia.
We will analyze the Peoria rental market data from 1st quarter and 2nd Quarter of 2013 and 2014 and compare it with data from 1st Quarter and 2nd Quarter to date in 2015.
Let's take a look at the Peoria and Vistancia rental market data.
The rental market numbers for Peoria in this study are interesting because they are not consistent with what we have experienced with the overall 2015 Phoenix Area Rental Market.
Overall, average rental prices in both Peoria and Vistancia have remained relatively flat during this 2013-2015 time period. The median rental price has increase from 2013 to 2015 in Peoria by $100, but has actually decreased in Vistancia. Rental property inventory decrease in these areas has not been as significant as the Phoenix rental market in general inventory decrease within the same time frame.
In Peoria average rental property rent rates in the time frames analyzed have increased only about 1% (from $1283 to $1298). The median rental price has shown an 8% increase.
Vistancia average and median rental prices have decreased in the time frame studied. What is interesting though is the Average Days on Market has decreased by almost 50% and median days on market has been cut in third from 54 days to 18 days. Based on this number, a price increase would be realistic to expect moving forward.