On September 21, 2015, we took a look at 5 cities in the Greater Phoenix Area and their important rental market numbers. We focused on the rental homes that rented between January and August and broke down the resulting rental price data by year for the years 2013-2015.
The cities and abbreviations we used were as follows:
Scottsdale (SCD)
Phoenix (PHX)
Peoria (PEO)
Avondale (AVD)
Buckeye (BUK)
The rental property data that we looked at focused on closed, unfurnished rental properties and was taken from the Arizona MLS.
Today we will update the data with the last quarter from each year included.
We will present three charts. The first chart shows raw rental price per square foot in each city.

The high rent area per sq. foot is in Scottsdale where the rent is close to double the rent per sq. foot in Buckeye. All cities show an increase in rent price.
The next chart shows rental property inventory.

This chart shows the decrease in rental market inventory over the last three years. It also shows that the number of properties in Phoenix for rent is greater than all of the other markets combined.
The final Chart shows the increase in rent price/decrease inventory as a percentage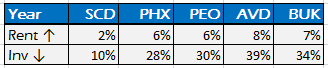

This one shows a pretty consistent rental market price gain in all of the cities we looked at except for Scottsdale which remained relatively flat. The updated numbers show Avondale as have the largest percentage rent increase and rental inventory drop from 2013-2015.
